Healthy soils are crucial to sustain biological productivity, maintain environmental quality, and promote plant and animal health. Soils are a key indicator of the overall health of an ecosystem and are critical for sustainable land management and restoration. Soil Organic Carbon (SOC) and Erosion are two strong indicators for soil health. Healthy soils are generally associated with high SOC concentrations and low erosion levels, and vice versa.
Soil Organic Carbon (SOC) is a key component of soil organic matter and plays a crucial role in maintaining soil fertility, ecosystem productivity, and resilience to climate change. It is a primary indicator of ecosystem health because it reflects the soil’s ability to store carbon, support plant growth, regulate water, and resist degradation. SOC levels are crucial for sustaining agricultural and ecological functions.
Relationship Between SOC and Vegetation:
Vegetation contributes to SOC levels through leaf litter, root biomass, and organic inputs from plant residues. In African landscapes, tree cover, grasses, and shrubs all influence SOC accumulation. Agroforestry and trees of farms can enhance SOC by increasing biomass inputs and reducing soil erosion. Conversely, overgrazing, deforestation and human pressure reduce SOC levels by depleting organic inputs and exposing soil to erosion.
This map shows Soil Organic Carbon (SOC) across Rwanda for the year 2023. This was calculated using the CIFOR-ICRAF soil and vegetation database which contains thousands of ground measurements in- and outside Rwanda. By combining these ground data with Landsat 8 satellite images and machine learning, we can make accuracte maps of SOC for large areas.

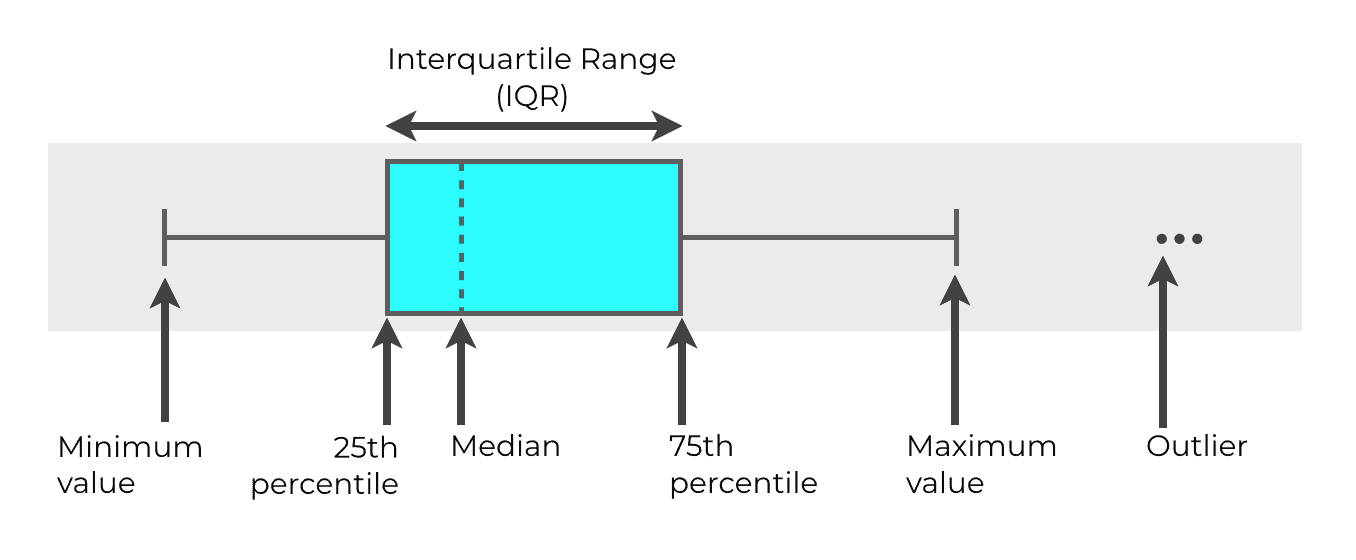
Below is a boxplot. This boxplot shows the distribution of soil organic carbon in each district in Rwanda. If the box is wide, it means that there are a large differences in soil organic carbon in that district.
The red, orange and green lines indicate low, medium and high level of SOC. Lesss than 10 g/kg is considered low SOC concentrations in Rwanda.
This example boxplot shows the meaning of lines in a boxplot:
In the map below you can see the change in soil organic carbon in the period 2018-2023. Negative values mean that there has been a decrease while positive values indicate an increase in SOC between 2018-2023. Explore the changes yourself by clicking anywhere on the map!
Soil organic carbon concentrations vary throughout Rwanda. Also, how SOC has changed in recent years varies considerably per distrcict. Select a province of Rwanda to see how SOC concentrations have changed in the districts in that part of the country!
Soil erosion in Africa is a widespread issue, particularly in drylands, savannas, and areas with intense seasonal rainfall. It occurs through various processes:
Deforestation: The removal of trees for agriculture, firewood, or development exposes the soil to wind and rain.
Overgrazing: Excessive livestock grazing removes vegetation cover, loosening the soil and making it more prone to erosion.
Unsustainable farming practices: Continuous plowing and monocropping degrade soil structure, making it more susceptible to erosion.
Extreme weather events: Climate change has led to increased droughts and heavy rainfall, both of which accelerate erosion.
Relationship Between Erosion and Vegetation:
When vegetation is removed, erosion accelerates because there are no roots to hold the soil together, no plant cover to slow down water movement, and no organic matter to enhance soil fertility. This leads to land degradation, loss of agricultural productivity, and even displacement of communities due to declining land quality. Integrating trees with crops (agroforestry) helps stabilizing the soil, reduce wind and water erosion, and improve soil fertility. Through this and other sustainable land management practices, we can reduce erosion and improve soil health.
This map shows erosion across Rwanda for the year 2023. This was calculated using the CIFOR-ICRAF soil and vegetation database which contains thousands of ground measurements in- and outside Rwanda. By combining these ground data with Landsat 8 satellite images and machine learning, we can make accuracte maps of erosion for large areas.
In the graph below you can see the change in erosion prevalence in the period 2018-2023 at the sector level. When the dark blue boxplot is lower than the light blue boxplot, it means that there has been an decrease in erosion, which is generally positive for eocystem health.
Erosion prevalence varies a lot throughout Rwanda. Not only the level of erosion prevalence, but also the extent to which erosion has changed between 2018-2023 varies considerably per distrcict. Select a province of Rwanda yourself to see how erosion has changed in the districts in that part of the country!