Land health is a measure of the capacity of land to sustain biological productivity, maintain environmental quality, and promote plant and animal health. It is a key indicator of the overall health of an ecosystem and is critical for sustainable land management and restoration.
This map shows tree cover across Rwanda for the year 2023. This was calculated using the CIFOR-ICRAF soil and vegetation database which contains thousands of ground measurements in- and outside Rwanda. By combining these ground data with Landsat 8 satellite images and machine learning, we can make accuracte maps of tree cover for large areas.

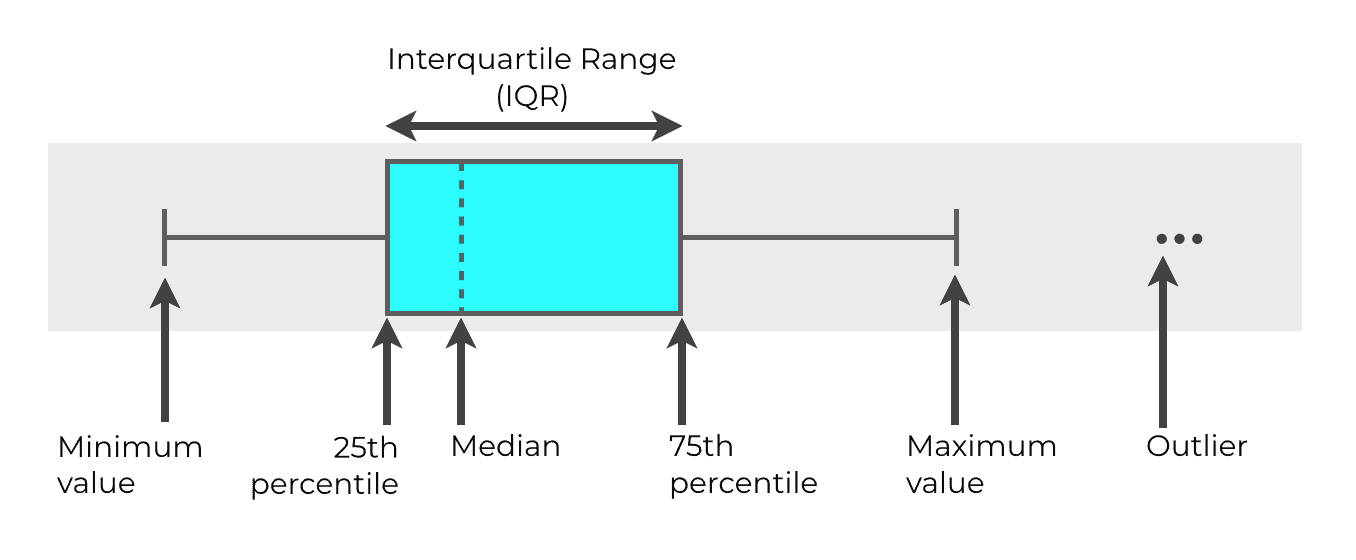
Below is a boxplot. This boxplot shows the distribution of tree cover in each district in Rwanda. If the box is wide, it means that there are a large differences in tree cover presence in that district.
This example boxplot shows the meaning of lines in a boxplot:
Explore the changes in tree cover in the period 2018-2023. You can click anywhere on the map to see the changes in tree cover in that area.
Tree cover change is different throughout Rwanda. Select a province to see the change in tree cover in the districts in that province. The light green indicates the tree cover for 2018 while dark green indicates the tree cover in 2023.
In our analysis, we predict tree cover as the probability of tree presence between 0-100%. Following the definitition of tree cover categories from the Rwanda Forestry Authority, we define tree density in Rwanda in four classes using the following thresholds:
Very low - 0-10%
Low - 10-40%
Medium - 40-70%
High >70%.
The analysis below uses these thresholds to compare the tree density in 2023 to 2018. Select a district to see the trend in tree densities.